Map Notes for 2008 WRX MT North American and ADM Spec

Supported Vehicles:
- Model year 2008 WRX MT (North American, ADM Spec)
*To confirm your model year, you can refer to the tenth value in the VIN number on the vehicle. For model year 2001-2009, the 10th value in the VIN will be the last digit of the model year. For model year 2010-2019, the 10th value in the VIN will be A-K, starting with 2010, ending with 2019.
Current Map Revision:
| 2008 USDM | 2008 ADM | |
|---|---|---|
| Stage 1, 1+ | v400 | v301 |
Accessport Firmware:
- AP3-SUB-003: 1.7.4.0-17431 or greater
- AP3-AU-SUB-003: 1.7.4.0-17431 or greater
Fuel Requirements:
Each map lists the minimum required octane. A higher octane fuel can be used safely on a map designed for lower octane. DO NOT use maps designed for higher octane with lower octane fuels. Top Tier gasoline should be used where available.
- Maps designated with "93" are for use with 93 octane fuel (98 RON) or better.
- Maps designated with "91" are for use with 91 octane fuel(95 RON) or better.
Maps designated with “ACN91” are for use with 91 octane fuel found in Arizona, California, and Nevada or better.
These maps are designed for E10 fuel (fuel with 10% ethanol content). For those who only have access to E0 fuel (fuel with 0% ethanol) it is recommended to use the "91" octane version of the maps and datalog the car to ensure your fuel is performing to the necessary level. This is especially important for those using Canadian 94 octane E0 fuel.
Stage1, 1+
Map | Peak Gains* |
|---|---|
Stage1 ACN91 | +5% HP / +8% TQ over stock |
| Stage1 91 | +7% HP / +10% TQ over stock |
| Stage1 93 | +9% HP / +10% TQ over stock |
Results may vary. Power as tested on 2008 WRX vehicles using these identical calibrations. Generally speaking, the 91 (95 RON) and ACN91 calibrations run slightly lower boost, have a richer fuel curve, and a less aggressive ignition advance map to help compensate for 91 octane fuel; Arizona, California, and Nevada 91 octane fuel; and/or less than ideal atmospheric conditions. The maps designed for 93 (98 RON) octane are the most aggressive.
Stage1
- Intake Requirements: Stock airbox with stock air filter.
- Exhaust requirements: Stock exhaust
- Boost Targets: ~13.0psi peak boost pressure tapering down to ~9.0psi by the 6700RPM redline, +/- 0.8psi
Stage1+SF
- Intake Requirements: COBB SF Intake 715300
- Exhaust requirements: Stock exhaust
- Boost Targets: ~13.0psi peak boost pressure tapering down to ~9.0psi by the 6700RPM redline, +/- 0.8psi
All Stage1 performance maps now include a “HWG” and “LWG” version:
- HWG: Higher wastegate duty cycles (HWG) for use when normal wastegate calibration produces lower than targeted boost (i.e. under boost).
- LWG: Lower wastegate duty cycles (LWG) for use when normal wastegate calibration produces higher than targeted boost (i.e. over boost).
*The addition of any other hardware may make the vehicle perform poorly.
Non-Performance Maps
Anti-Theft Mode
- Will not allow vehicle to start
Economy Mode MT, Intake+Economy Mode
- Boost Targets: Mechanical Minimum (Typically around 6psi - 12psi)
Valet Mode Mt
- Boost Targets: Mechanical Minimum (Typically around 6psi - 12psi)
- Rev Limiter: 3200 RPM
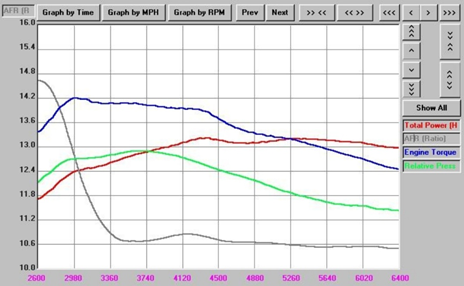
The above dyno graph demonstrates the fuel curve that should be measured from the exhaust stream. The RPM reference can be found on the X-axis in pink numbers; the A/F Ratio reference can be found on the Y-axis in black numbers. If your fuel curve is not within +/- 0.4 A/F from this calibration, then you may need to have the vehicle analyzed by a professional tuning facility. Hardware such as drop-in panel filters and intakes can skew the MAF sensor signal and create a dangerously lean fuel curve. This calibration has been established to run with the stock intake system using the stock intake filter only.
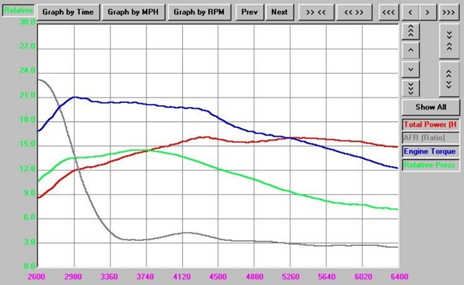
The above dyno graph demonstrates the relative pressure (boost) curve that should be measured from the intake manifold. The RPM reference can be found on the X-axis in pink numbers; the relative pressure (boost) can be found on the Y-axis in green numbers. If your boost curve is not within +/- 0.8psi from this calibration then you may need to have the vehicle analyzed by a professional tuning facility.
The above dyno graph demonstrates the fuel curve that should be measured from the exhaust stream. The RPM reference can be found on the X-axis in pink numbers; the A/F Ratio reference can be found on the Y-axis in black numbers. If your fuel curve is not within +/- 0.4 A/F from this calibration, then you may need to have the vehicle analyzed by a professional tuning facility. Hardware such as drop-in panel filters and intakes can skew the MAF sensor signal and create a dangerously lean fuel curve. This calibration has been established to run with the stock intake system using the stock intake filter only.
Monitoring Boost Levels:
The best way to determine if you are hitting target boost is to watch the TD Boost Error parameter. This parameter is your target boost (including altitude and temperature compensations) minus your actual boost (negative values mean you are over the target by the amount while positive values mean you are under). Ideally you want this value to be between 0 and 1.0 at wide open throttle (WOT), but -1.0 to 1.0 is acceptable assuming that you don’t have any significant knock corrections. Overboosting is more likely to occur in higher gears and with colder outside temperatures, so be sure to verify boost levels during these conditions.
High Altitude:
A quick note for those of you that live at higher altitudes. It is common for turbocharged cars at higher altitudes to run less boost pressure due to lower air pressure and air density. Your turbocharger has to work harder to compress a less dense air mass compared to the same turbocharger at sea level. This must be factored in when determining if your turbocharger is running the proper amount of boost pressure and not being pushed beyond its efficiency range.
Example: If you live in Denver at 5280 ft and are trying to run a peak boost pressure of 15 psi, your turbocharger has to work the equivalent of making ~17.5 psi at sea level.
There are barometric compensations within the factory ECU that lower boost targets as you climb in altitude in an effort to keep the turbocharger in its optimal range.The COBB performance maps utilize these compensations and therefore, it is perfectly normal for the final boost target to be lower than what is listed for your map.
Revision Notes:
| Version # | Notes: |
|---|---|
| v400 | Maps updated to eliminate unnecessary DTC Supression or updated versions for parity with other maps/vehicles within the platform |
| v350 | Maps have been updated to eliminate unnecessary DTC suppression. |
| v301 | Added ADM support |
| v300 | Now compatible with Launch Control and Flat-Foot Shifting (LC/FFS) features (MT only). For complete details on how to enable and use the LC/FFS functionality, please visit this FAQ. These maps have been created with the newly-released Accesstuner Pro 1.9.0.0. Maps created with this version of Access Tuner software require the latest Accessport firmware (version 1.6.4.0-1189 or greater) be installed. All Accessports must first be updated before using maps created with this latest Access Tuner version. Accessport Manager 2.0 will automatically update the Accessport to the latest firmware version and is available for download on the COBB Tuning Support web page. |
| v200 | Initial release of mapping calibrated to support the COBB SF Intake. Adjusted boost, fuel, ignition, camshaft phasing, and base programming logic to improve driving quality and performance. Revised closed loop management for improved driving quality. Smoothed out boost related values, improved boost response at lower RPM. Altered intake camshaft phasing parameters in an effort to improve low and midrange torque and boost response. Smoothed ignition advance mapping for low to mid RPM response. Simplified ignition timing strategy to remove undesirable additive/jumping timing behavior. |
| v102 | Updated calibration to increase the window for knock feedback activity. |
| v101 | Revisions made to boost cut settings to raise them to appropriately safe levels. |
| v100 | Original mapping. Adjusted Fuel, Ignition Advance, Boost Control, Camshaft Phasing (AVCS), close loop control, knock corrections, throttle mapping, and base programming logic. Revised Closed Loop management for improved driving quality. Smoothed out boost related values, improved boost response at lower RPM. Altered intake camshaft phasing parameters in an effort to improve low and mid-range torque and boost response. Smoothed ignition advance mapping for low and mid RPM response. |
Copyright 2023 © COBB Tuning Products LLC. All Rights Reserved. | www.cobbtuning.com