Any time you change out a sensor on your car to one that isn’t factory such as upgrading the map sensor to a 4 bar unit, (such as this fantastic option) adding a fuel pressure sensor etc. you’ll need to ensure the scale is set up appropriately in your tune in order to have it read accurately and not cause problems.
Get Data From the Manufacturer
While ideally a manufacturer will have data available for their sensors, it isn’t always the case. As such you may find yourself needing to do some math to get the data required to make your sensor read appropriately.
If the exact data required isn’t available the absolute MINIMUM data required to be able to calculate the rest correctly and accurately is.
Voltage range of operation
While you would expect sensors to go from 0v at the bottom, most will actually start at a higher voltage like .5v in order for the ECU to see a minimum voltage level and be able to detect faults like wiring or sensor issues. Some sensors operate 0.5v to 4.5v, while others are 0v to 5v. While this doesn’t seem like a huge difference, it can be the difference between your engine running or not.Pressure Range
Knowing the range gives us something to work with.Example1 the COBB 100psi Fuel Pressure sensor can up to 100psi.
Example2 For MAP sensors the majority of the time their rating is in Absolute pressure not relative. The COBB 4bar map sensor reads 4 bar of Absolute Pressure (60psi)
| Info |
|---|
Absolute Pressure is the amount of pressure beyond a complete vacuum. Relative Pressure is the amount of pressure beyond the level of atmospheric pressure where you are. |
For the sake of learning the common use cases, we’ll continue with two examples, one of a 100 psi fuel pressure sensor and another as a 4bar map sensor.
| Note |
|---|
Keep in mind these are meant to be used as an example, and always MAKE SURE TO USE THE APPROPRIATE VALUES FOR THE SENSOR YOU USE. |
The Math
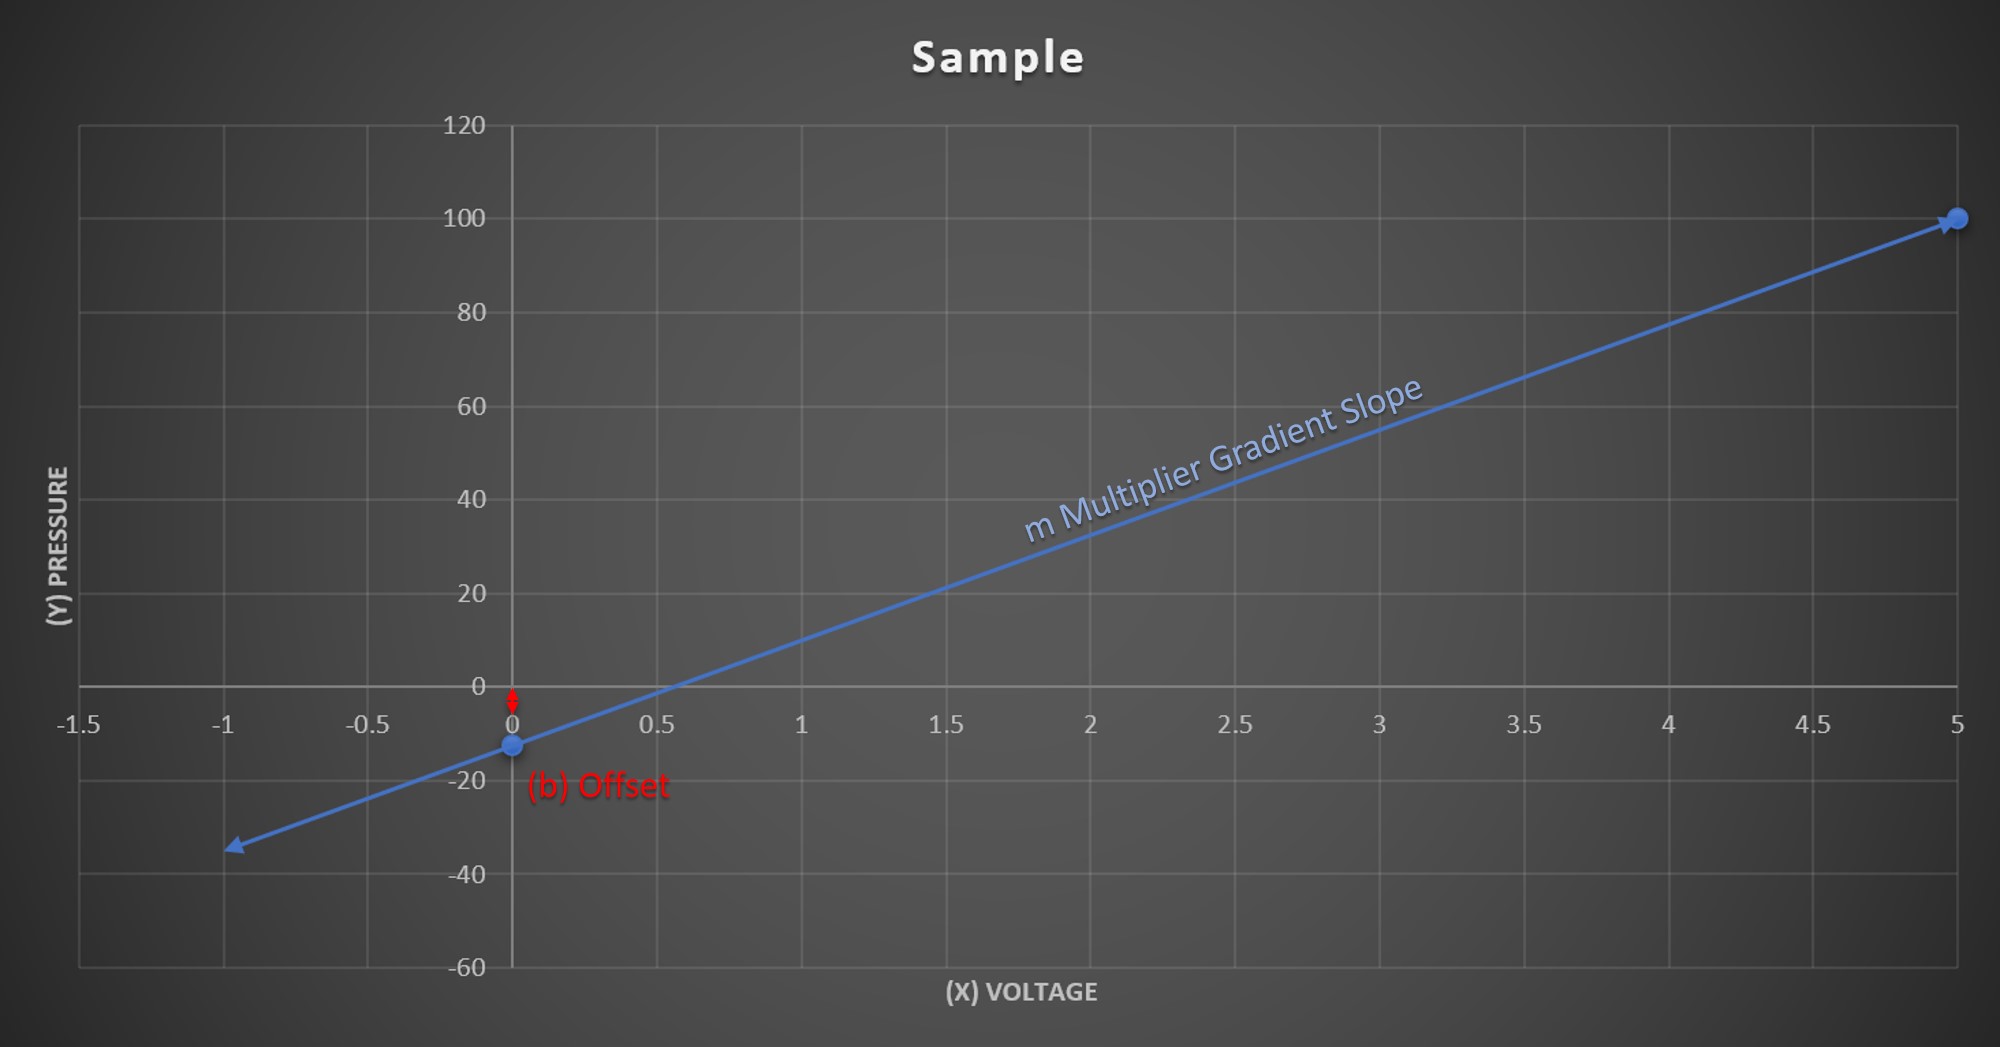
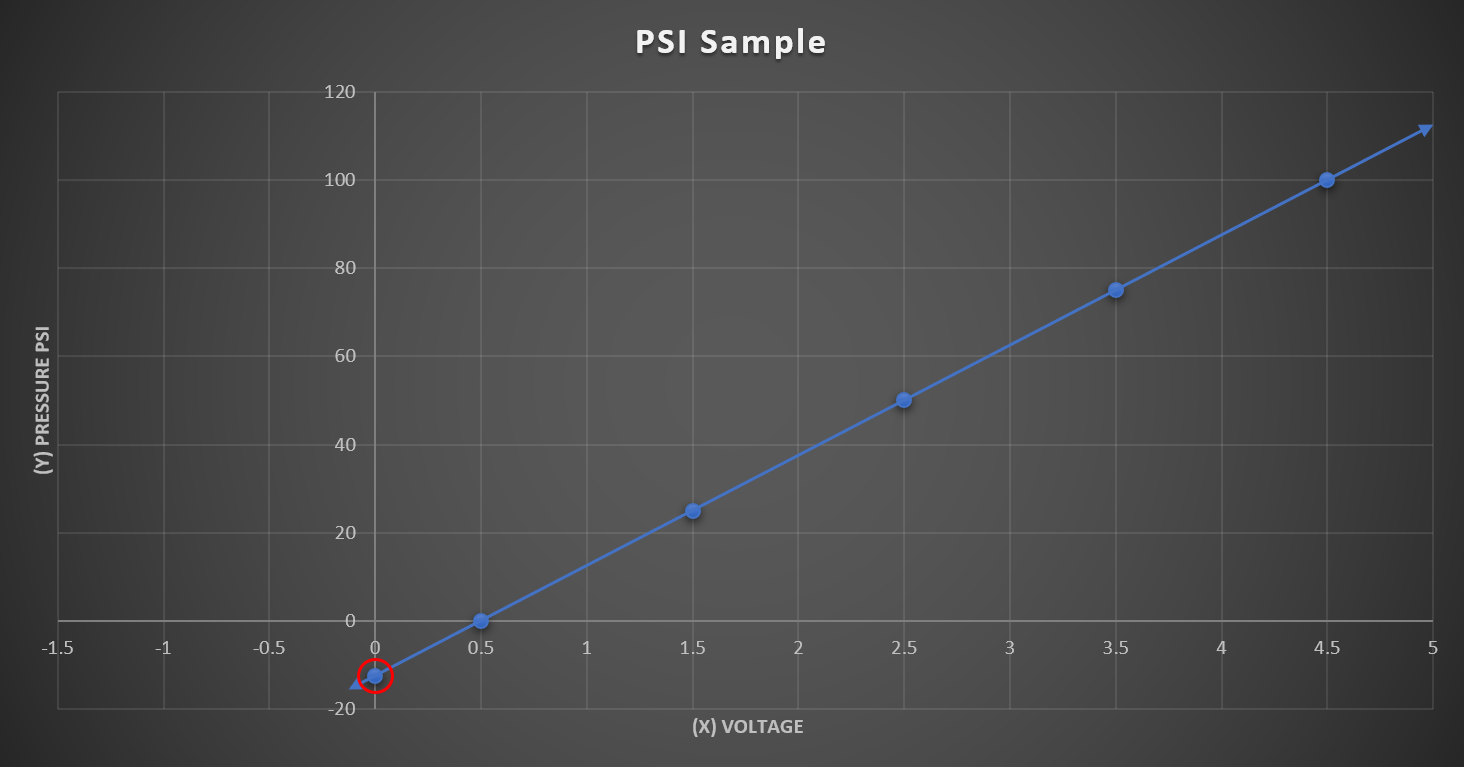
In general, what we’re attempting to do is figure out the relationship of voltage to pressure. When graphed it should create a straight line or slope. Knowing this we go back to math class and calculating the slope of a line.
In case you don’t remember back all those years ago (I didn’t), the formula for doing so is y=mx+b.
y is going to represent your output value (pressure etc.) typically on the Y-Axis of the graph
x is the voltage output typically the X-Axis of the graph
m is your multiplier or gradient. Establishing how many of your output unit exist for every x unit
b is the offset for your values. This is also called the y-intercept, as it is the value the line will take in a graph that intersects the y-axis when the x value is 0.
100psi Fuel Pressure Example |
|---|
Operating Voltage Range: 0.5v-4.5v |
4 bar Map Sensor Example |
|---|
Operating Voltage Range: 0.5v-4.5v |
This Information nets us the basic axis for the graph
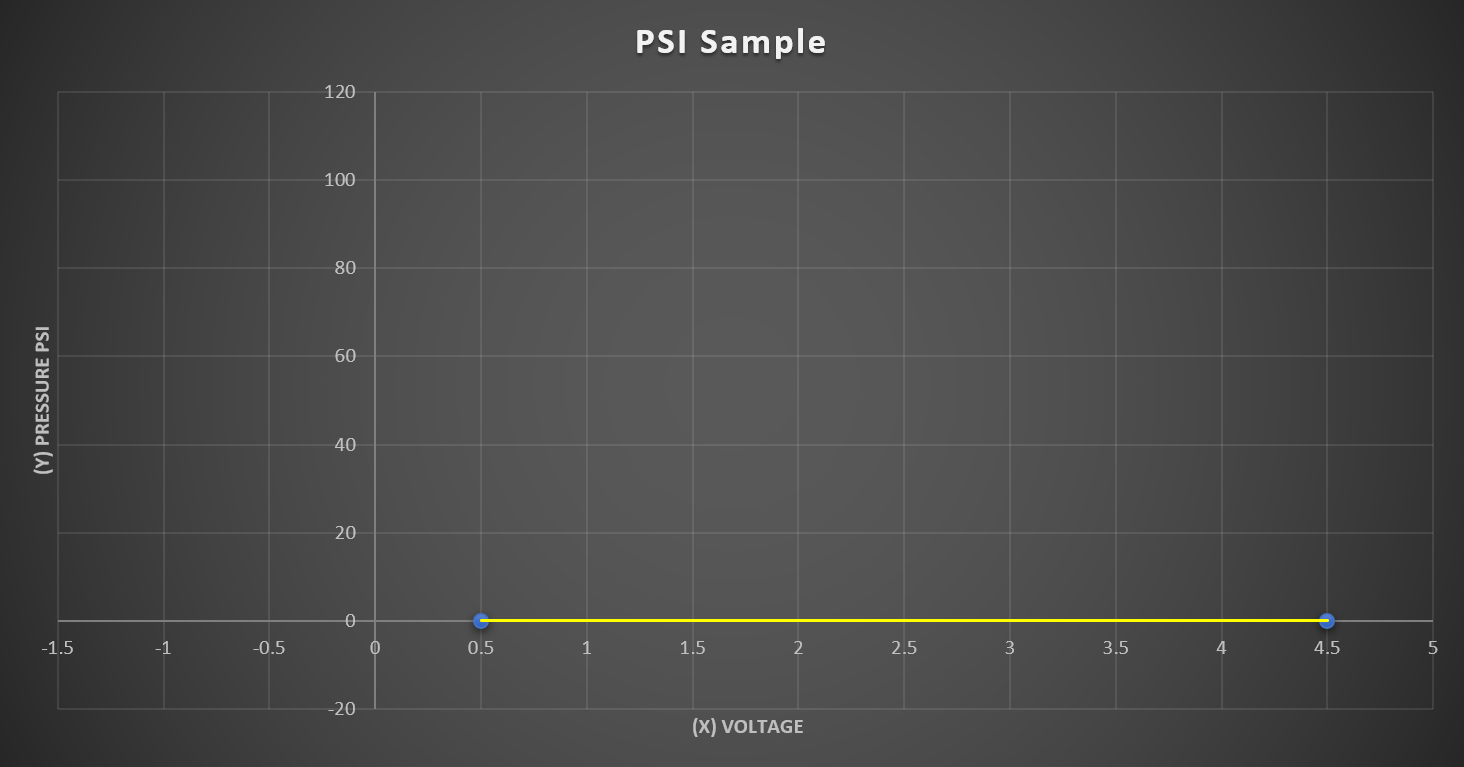
Voltage Range Calculation
Range is some of the easiest math required once we know the operating voltage of the sensor.
Range = Highest Output Voltage – Lowest Output Voltage |
|---|
The range lets us know how large of a voltage sweep to expect from the sensor. We figure out how large of a voltage range there is by simply subtracting the high voltage limit from the low voltage limit. With the operating range we can figure out many other things.
100psi Fuel Pressure Example |
|---|
Operating Voltage Range: 0.5v-4.5v Range = Highest Output Voltage (4.5v) – Lowest Output Voltage (.5v) |
4 bar Map Sensor Example |
|---|
Operating Voltage Range: 0.5v-4.5v Range = Highest Output Voltage (4.5v) – Lowest Output Voltage (.5v) |
Calculate Gradient/Multiplier
The Gradient value tells the computer how many units (either psi or KPA) are in each volt output by the sensor. This establishes the scale for the sensors readings. And helps us to better understand the relationship between the x and y-axis
Gradient = Pressure / Range (voltage) |
|---|
100psi Fuel Pressure Example |
|---|
Voltage Range: 0.5v-4.5v Gradient = Pressure (100psi)/ Range (4v) |
Base Equation y=mx+b
With Gradient y=25x+b
4 bar Map Sensor Example |
|---|
Voltage Range: 0.5v-4.5v Gradient = Pressure (60psi)/Range(4v) |
Base Equation y=mx+b
With Gradient y=15x+b
Calculate Offset / Y-Intercept
Offset = Voltage Output Minimum x Gradient |
|---|
Since most pressure sensors do not read zero at 0.5v we need to add an offset into the equation as well.
Much like setting a scale to 0 before you step on. Since many sensors like our example one will show voltage at what should be when there is no pressure, we need to tell the computer to offset in order to read appropriately. We do that by finding out what the reading would be at the lowest output voltage, and adding the opposite (in many cases negative) of that value. In order to find that value, we’ll multiply the lowest voltage output by the gradient. Once it is in the table, the software uses that value to zero things out at 0.5v, that way the computer can offset correctly.
Keep in mind that if the sensor reads zero pressure at a voltage other than 0.0v, you’ll end up with a negative offset value.
Now that we’re just down to the x and y values as variables in the equation the computer (or a human) can easily figure out what the values should be for y (pressure) when presented with the voltage output from the sensor.
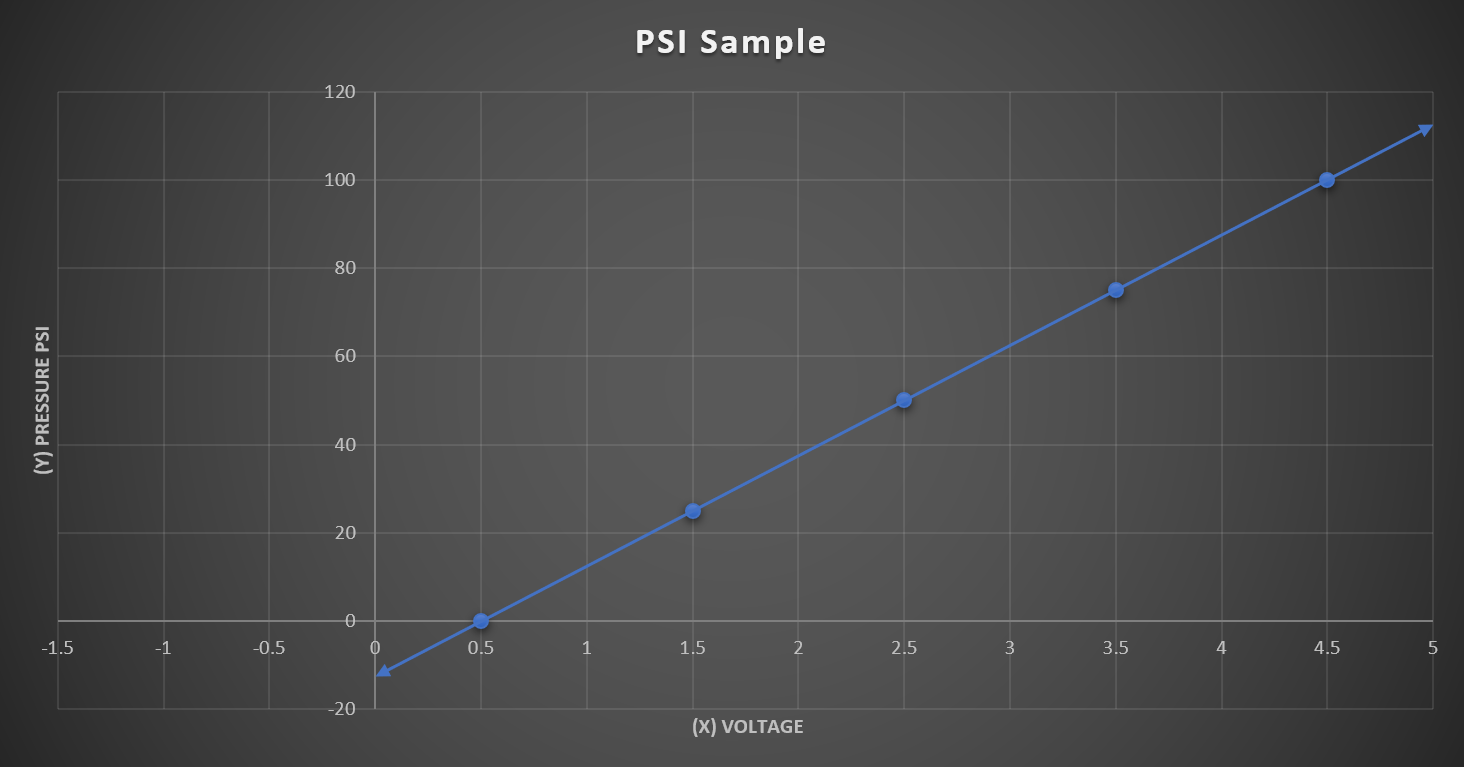
100psi Fuel Pressure Example |
|---|
Operating Voltage Range: 0.5v-4.5v Offset = Voltage Output Min (0.5v) x Gradient (25psi/v) |
Base Equation y=mx+b
With Gradient y=25x+b
With Offset y=25x-12.5
Voltage | Pressure |
|---|---|
0 | -12.5 |
0.5 | 0 |
1 | 12.5 |
1.5 | 25 |
2 | 37.5 |
2.5 | 50 |
3 | 62.5 |
3.5 | 75 |
4 | 87.5 |
4.5 | 100 |
4 bar Map Sensor Example |
|---|
Operating Voltage Range: 0.5v-4.5v Offset = Voltage Output Min (0.5v) x Gradient (15psi/v) |
Base Equation y=mx+b
With Gradient y=15x+b
With Offset y=25x-7.5
Voltage | Pressure |
|---|---|
0 | -7.5 |
0.5 | 0 |
1 | 7.5 |
1.5 | 15 |
2 | 22.5 |
2.5 | 30 |
3 | 37.5 |
3.5 | 45 |
4 | 52.5 |
4.5 | 60 |
Convert to Required Units
| Info |
|---|
It’s a good idea to know what unit your car wants before you begin. Doing this step earlier before calculating the gradient and offset will mean you only have to do the math one time. |
It’s important to convert the format of the data we have for the sensors to the appropriate format so that they are used correctly. Typically most systems either want values in kpa (kilopascals) or psi (pounds per square inch). For the purposes of our example, we’re going to convert to kpa since that is what most systems prefer. If your vehicle wants it in a different form of units, you’ll want to convert to that. If it prefers PSI, you’re all done!
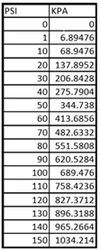
Convert to KPA = Pressure(psi) x 6.89476 |
|---|
To Convert to KPA you’ll either multiply your value (in psi) by 6.89476, or use the table at the right to figure things out. (tossing it in to google also works as the conversion is pretty fast)
100psi Fuel Pressure Example |
|---|
Operating Voltage Range: 0.5v-4.5v Pressure limit KPA: 689.476 |
4 bar Map Sensor Example |
|---|
Operating Voltage Range: 0.5v-4.5v Pressure limit KPA: 413.6856 |
| Info |
|---|
Not all vehicles want everything in the same format. Make sure you’re using the correct units relative to what it’s asking for! |