
Supported Vehicles:
- 2014-2016 Porsche 911 (991.1) Turbo PDK WM
- 2014-2016 Porsche 911 (991.1) Turbo S PDK WM
Map Revision:
- Stage0 v200
- Stage1 v200
Stage2 v200
Stage3 v200
Required Accessport Firmware:
- AP3-POR-006: 1.7.3.0-15013 or greater
Map Availability:
- Download from the COBB Tuning Porsche Map Database
PDK Map Notes Location:

Hardware Requirements:
Stage2 maps require a BBi, Akrapovič, or similar aftermarket exhaust system upgrade (high flow exhaust and 200 cell cats).
Fuel Requirements:
Each map lists the minimum required octane. A higher octane fuel can be used safely on a map designed for lower octane. DO NOT use maps designed for higher octane with lower octane fuels. Top Tier gasoline should be used where available.
- Maps designated with "100" are for use with 100 octane/102 RON fuel or better
- Maps designated with "93" are for use with 93 and 94 octane/98 RON fuel or better.
- Maps designated with "91" are for use with 91 and 92 octane/95 RON fuel or better.
- Maps designated with "ACN91" are for use with 91 octane fuel found in Arizona, California, and Nevada or better.
These maps are designed for E10 fuel (fuel with 10% ethanol content). For those who only have access to E0 fuel (fuel with 0% ethanol) it is recommended to use the "91" and "ACN91" octane versions of the maps and datalog the car to ensure your fuel is performing to the necessary level. This is especially important for those using Canadian 94 octane E0 fuel.
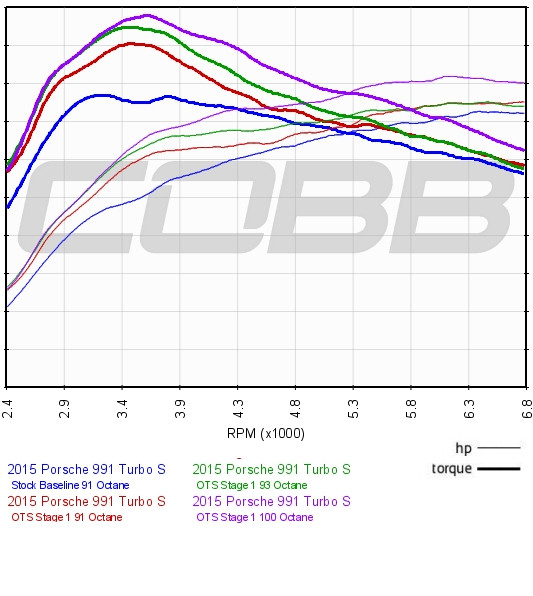
Stage 1
| Map | Peak Gains* | Largest Gain* |
|---|---|---|
Stage1 91 | +3.44% HP, +17.57% TQ | +20.49% HP, +20.48% TQ |
Stage1 93 | +3.44% HP, +23.21% TQ | +26.17% HP, +26.28% TQ |
Stage1 100 | +12.62% HP, +27.12% TQ | +30.13% HP, +30.51% TQ |
Results may vary. Power as tested on 2015 Porsche 991.1 Turbo S In Sport Plus Mode.
Peak Gains are measured as the absolute maximum value between the highest points of two plots.
Max. Gains are measured as the average maximum value between the highest and lowest point of two plots.
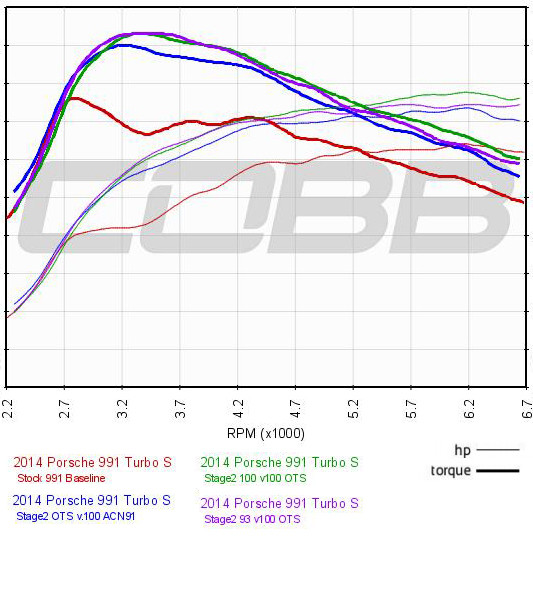
Typical Stage2 vs Stock Power:
Stage2 93:
Results may vary. Power as tested on 2015 Porsche 991.1 Turbo S In Sport Plus Mode.
Stage 1
- Exhaust Requirements: Stock
- Intake Requirements: Stock air box with stock air filter
- Boost Targets: 19psi on Normal Mode, 20.5psi on Sport Mode (+/-1 PSI)
Peak Gains are measured as the absolute maximum value between the highest points of two plots.
Max. Gains are measured as the average maximum value between the highest and lowest point of two
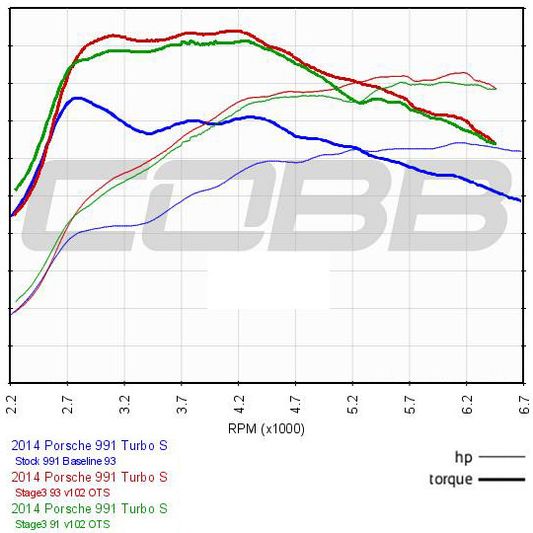
Typical Stage3 vs Stock Power:
Stage3 93:
plots.
Power as tested on 2015 Porsche 991.1 Turbo S In Sport Plus Mode.
Peak Gains are measured as the absolute maximum value between the highest points of two plots.
Max. Gains are measured as the average maximum value between the highest and lowest point of two
Map Version Notes:
- Stage 1
- Exhaust Requirements: Stock
- Intake Requirements: Stock air box with stock air filter
- Boost Targets: 19psi on Normal Mode, 20.5psi on Sport Mode (+/-1 PSI)
- Stage 2
- Exhaust Requirements: BBi, Akrapovič, or similar aftermarket exhaust system upgrade.
- High Flow Exhaust (larger diameter piping)
- High flow catalytic converters (200 cell).
- Intake Requirements: Stock air box with stock air filter or upgraded panel filter.
- Boost Targets: 19.5psi on normal mode, 21psi on Sport mode. (+/-1 PSI)
- Exhaust Requirements: BBi, Akrapovič, or similar aftermarket exhaust system upgrade.
- Stage 3
- Exhaust Requirements: BBi, Akrapovič, or similar aftermarket exhaust system upgrade.
- High Flow Exhaust (larger diameter piping)
- High flow catalytic converters (200 cell).
- Intercooler Requirements: Thicker core intercoolers required.
- Intake Requirements: Stock air box with stock air filter or upgraded panel filter.
- Boost Targets: 20.5psi on normal mode, 21.5psi on Sport mode. (+/-1 PSI)
- Exhaust Requirements: BBi, Akrapovič, or similar aftermarket exhaust system upgrade.
| Note | ||||||
|---|---|---|---|---|---|---|
SBR(Stock Boost Response) vs. ABR(Aggressive Boost Response)
|
|
Non Performance Maps
Stage 0
- Stock calibration. Factory map that the car was delivered from Porsche with. Does not uninstall Accessport.
Closing Warnings and Precautions:
- Use of inappropriate calibration/modification combinations will promote engine damage
- Seek the help of a professional COBB Protuner should your Porsche Turbo fall outside of OTS map requirements.
- Top Tier gasoline should be used where available. Use of lower quality fuels can result in catastrophic engine damage.
For track events, we recommend adding at least 2 gallons of 100 octane fuel to battle high track temperatures.
Revision Notes:
| Map Version |
|---|
| Note: |
|---|
- Initial Release Calibration. Adjusted boost pressure targets airflow targets, ignition timing, RPM limits, vehicle Speed limits as well as other tables that help maintain drivability and increase performance all while maintaining reliability.
| v200 | Compatibility update for use with v201 and higher PDK maps (PDK Map Notes). |
| v102 | Added SBR(Stock Boost Response) and ABR(Aggressive Boost Response) maps. ABR maps are very similar to our initial release V101 maps. The new SBR maps have stock like boost response at partial throttle. |
v200:
Compatibility update for use with v201 and higher PDK maps (PDK Map Notes)| v101 | Initial Release Calibration. Adjusted boost pressure targets airflow targets, ignition timing, RPM limits, vehicle Speed limits as well as other tables that help maintain drivability and increase performance all while maintaining reliability. |