
Supported Vehicles:
Porsche 718 (982)
- 2017-2021 Porsche Cayman (982) S MT/PDK WM
- 2017-2021 Porsche Boxster (982) S MT/PDK WM
| Map Versions | 982 Base | 982 S | 982 GTS |
|---|---|---|---|
| Stage0 | v103/104 | v200/300 | v103/104 |
| Stage1 | v103/104 | v200/300 | v103/104 |
Required Accessport Firmware:
- AP3-POR-010: v1.7.4.2-19553
Map Availability:
- Download from the COBB Tuning Porsche Map Database
Each map lists the minimum required octane. A higher octane fuel can be used safely on a map designed for lower octane. DO NOT use maps designed for higher octane with lower octane fuels. Top Tier gasoline should be used where available.
- Maps designated with "93" are for use with 93 and 94 octane/98 RON fuel or better.
- Maps designated with "91" are for use with 91 and 92 octane/95 RON fuel or better.
| Warning |
|---|
Running 0% Ethanol Fuels These maps are designed for E10 fuel (fuel with 10% ethanol content). For those who only have access to E0 fuel (fuel with 0% ethanol) it is recommended to use the "91" and "ACN91" octane versions of the maps and datalog the car to ensure your fuel is performing to the necessary level. This is especially important for those using Canadian 94 octane E0 fuel. |
Stage 1 91 718 S
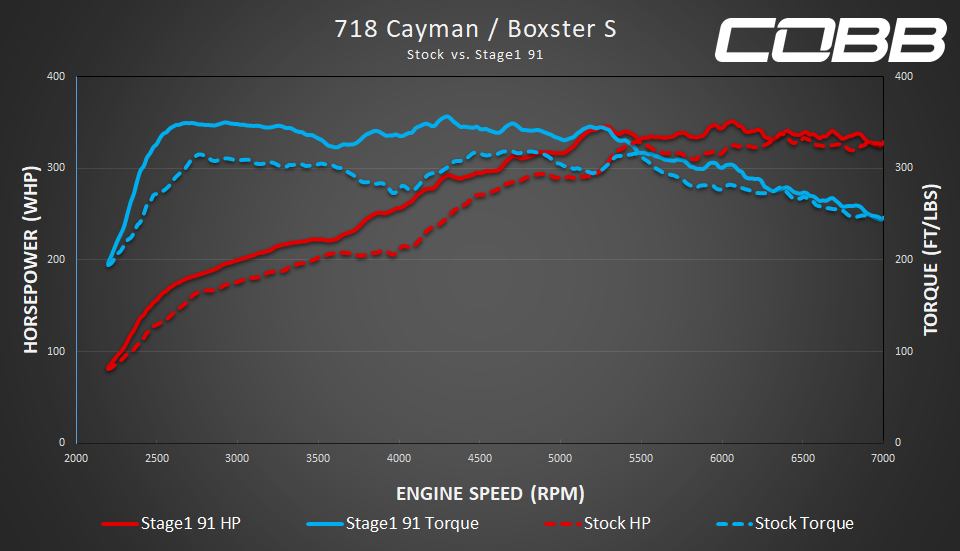
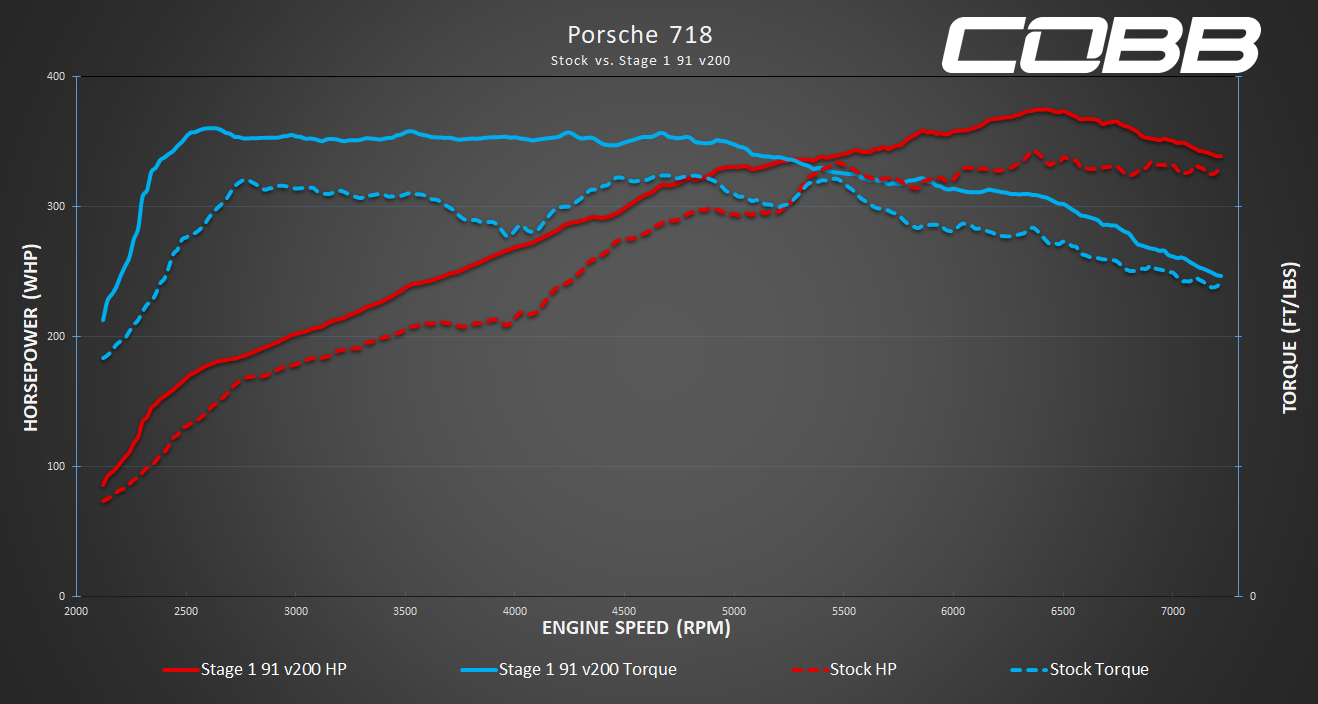
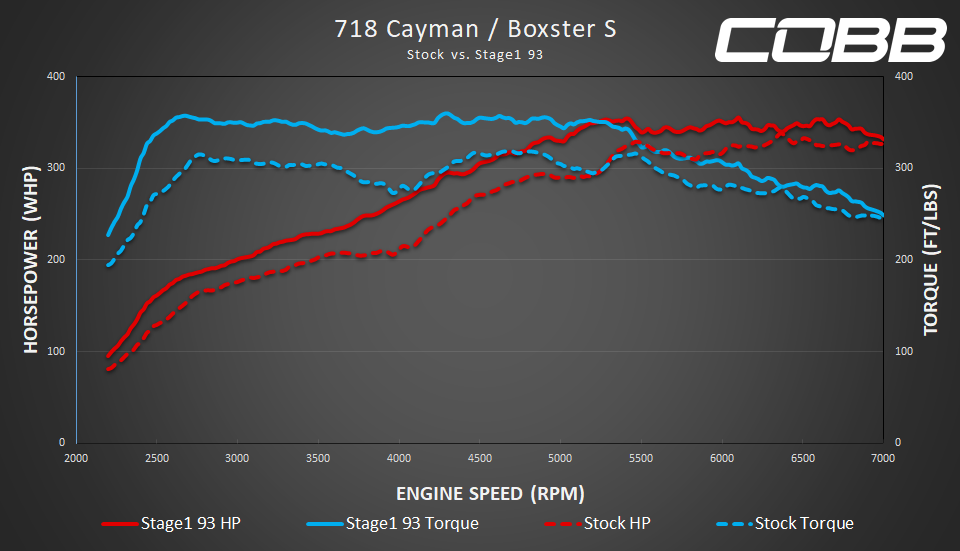
Stage 1 93 718 S
Map Version Notes:
| Insert excerpt | ||||||
|---|---|---|---|---|---|---|
|